
In 2022, a staggering 50% of children in the United States lived in households struggling to afford the basics of life, according to data from United For ALICE. While traditional measures of poverty indicate that 16% of children lived below the Federal Poverty Level (FPL), the ALICE (Asset Limited, Income Constrained, Employed) framework reveals a more troubling reality. An additional 34% of children belong to ALICE households—families earning above the FPL but still unable to make ends meet.
What Does It Mean to Be ALICE?
ALICE families face significant financial hardship, struggling to cover essential expenses like housing, childcare, food, transportation, healthcare, and technology. These households work hard but still find themselves unable to secure a stable financial footing. Understanding the distinction between poverty and the ALICE threshold is crucial for addressing the challenges these families face.
The ALICE Children Data Dashboard
To shed light on this pressing issue, the ALICE Children Data Dashboard below provides a comprehensive overview of the financial challenges children face across the nation. The dashboard details the number and percentage of children living in various income categories:
- Below the Federal Poverty Level: Children in extreme financial distress.
- Above the Poverty Level but Below the ALICE Threshold: Those living in ALICE households.
- Above the ALICE Threshold: Children in families that can meet their basic needs.
Exploring the Dashboard
The ALICE Children Data Dashboard includes two key tools to help users understand the dynamics of financial hardship among children:
-
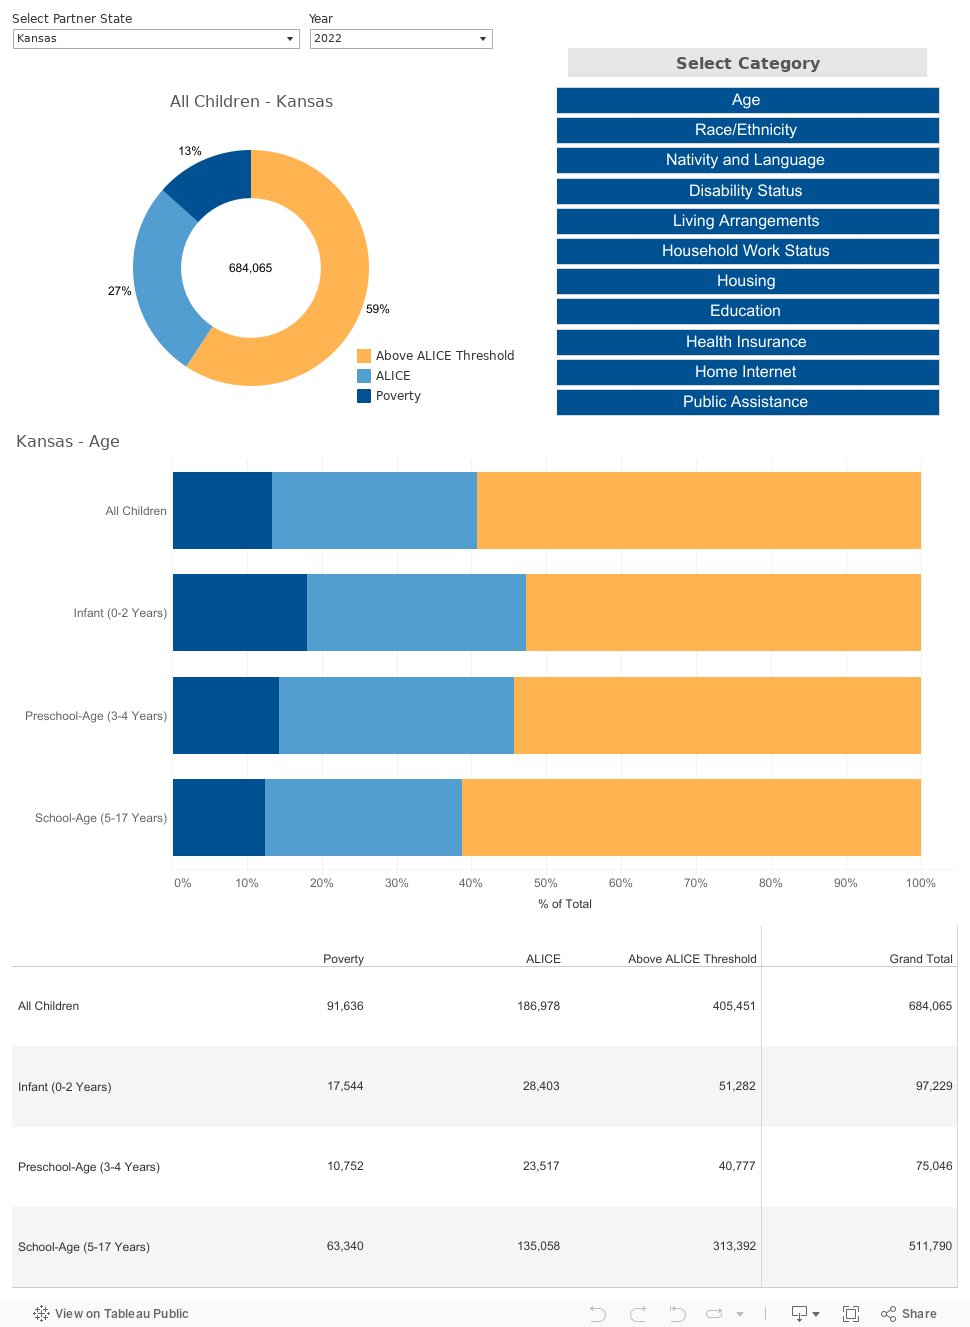
Hardship by Category: This tool allows users to explore data based on specific demographics, such as age, race/ethnicity, disability status, and living arrangements. Users can select a state or view national data, and see how children in various groups fare financially.
- How to Use:
- Data for Kansas is pre-selected but you may view the data for other states from the first drop down list.
- Select a year (2019 or 2022).
- Pick a demographic category.
- Hover over the bar graph to see the relevant data.
- How to Use:
-
Intersectional Hardship: This advanced tool enables users to combine various demographic factors to gain a deeper understanding of how different identities intersect to affect financial hardship.
- How to Use:
- Data for Kansas is pre-selected but you may view the data for other states from the first drop down list.
- Use drop-down menus to choose variables from different categories.
- The pie chart will dynamically update to reflect the data based on your selections.
- How to Use:
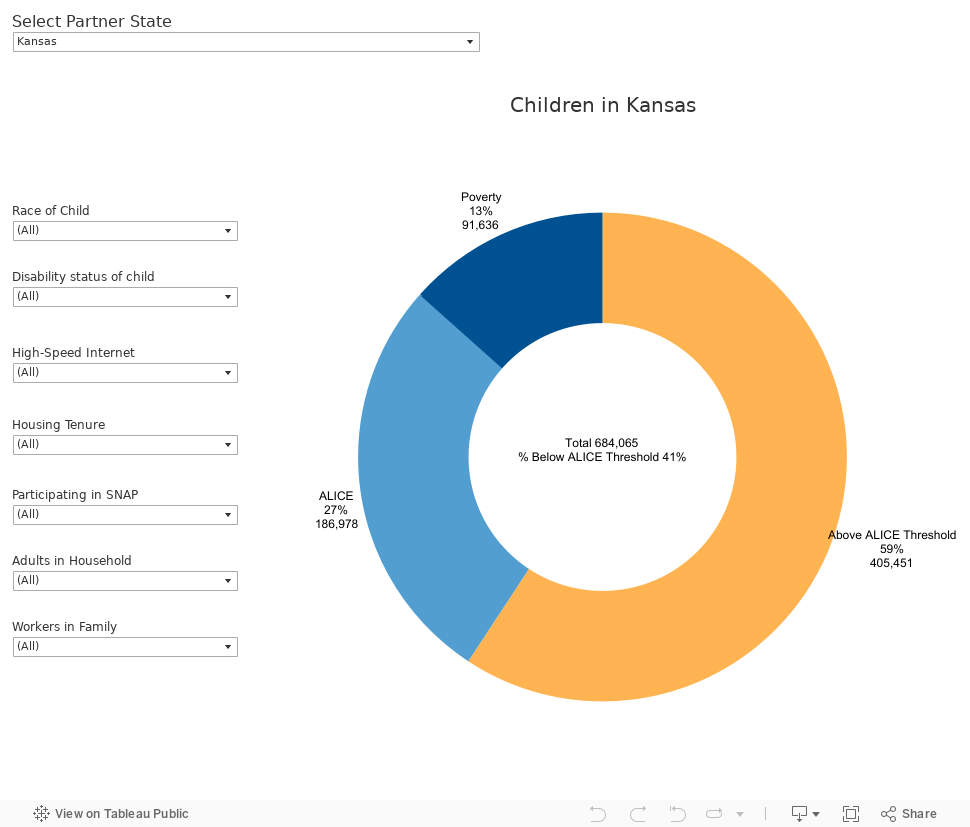
A Closer Look at Kansas
For those interested in a more localized analysis, the detailed research brief on ALICE Children in Kansas which you can access through this link offers insights into how these trends play out in our communities. Understanding the specific needs and circumstances of children in Kansas informs our targeted efforts to support families facing financial hardship through our partner agencies and you can help us further our efforts by contributing to our annual fundraising campaign.
This blog has been curated from the UNITED4ALICE - ALICE in Focus Series.